


The Broomes Island MD 201615 Real Estate Market Monthly Statistics for June 2019 are provided below. Peruse the GoldenResults.com current blog posts each month for any specific 30 day period. These blog posts will be static rather than automatically updated to preserve the month by month data. Click here to also view the current month statistics. All of the information is published by GetSmartCharts.com, owned by Showingtime.com, with data derived from BrightMLS.
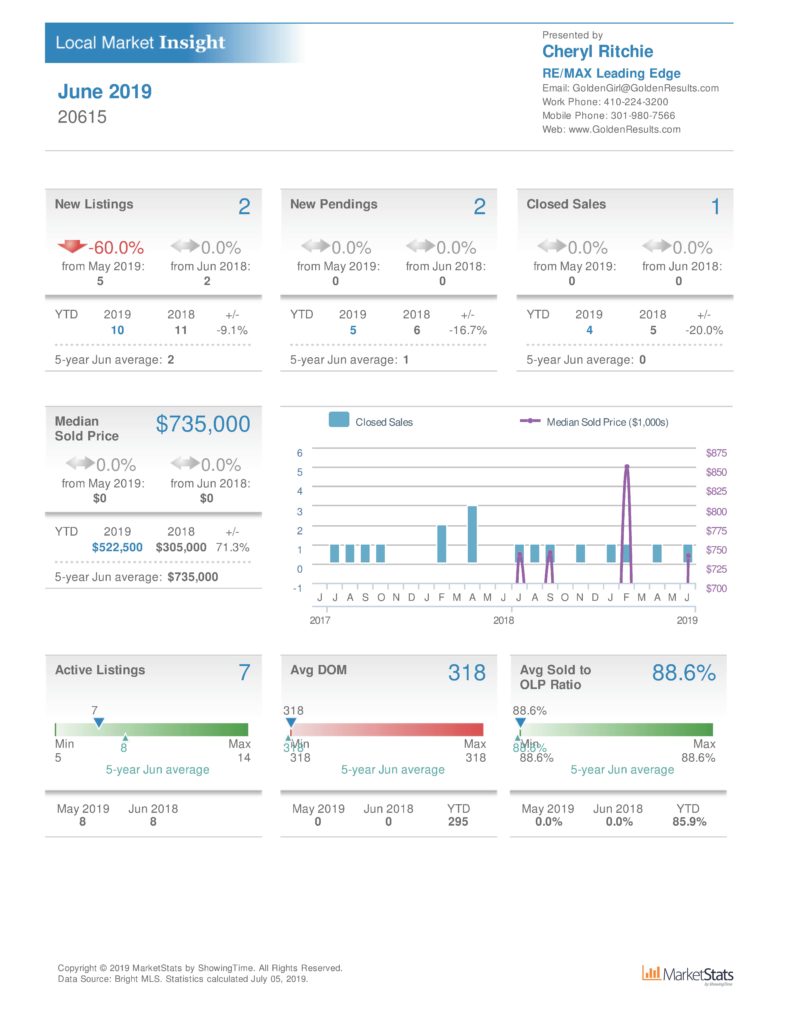
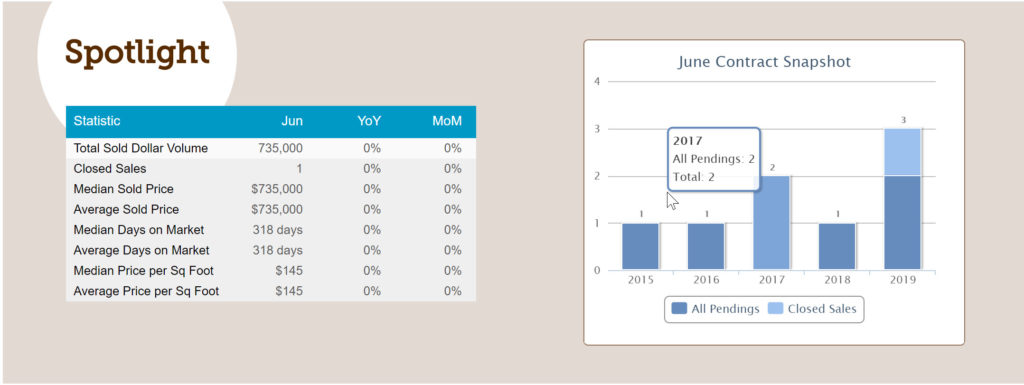
The Broomes Island MD 201615 Real Estate Market Monthly Statistics for June 2019 display Closed Sales, New Pendings, Active Listings, Months of Supply, New Listings, Median Sale Price, Median List Price for Actives, Average Sales Price, Average List Price for Actives, Median Days on Market, Average Days on Market, Median Sale to Original List Price Ratio, Average Sale to Original List Price Ratio, Median Sale Price per Square Foot, Median List Price per Square Footfor Active Listings, Average Sale Price per Square Foot and Average List Price per Square Ft for Active Listings.
Also included in the Broomes Island MD 201615 Real Estate Market Monthly Statistics for June 2019 are six interactive Charts that discuss Market Activity, Pricing Trends, Pricing Ratios, Days on Market, Price per Square Ft and Supply and Demand.
You’ll Retrieve Golden Results on all your Broomes Island MD 201615 Real Estate Market Monthly Statistics for June 2019 .If you would like to set up an appointment to review the statistics for a different Maryland Area to price your current home OR to make an offer on a home to find and purchase, contact Cheryl Ritchie, Associate Broker, RE/MAX Leading Edge, at Cell/Text 301-980-7566, EMail GoldenGirl@GoldenResults.com or GoldenResults.com. You’ll Retrieve Golden Results with Cheryl Ritchie for all your Southern Maryland and Anne Arundel County Real Estate Services.

Sorry, but we couldn't find any results in the MLS that match the specified search criteria.