Maryland Bright MLS Market Reports for week ending March 5 2023.
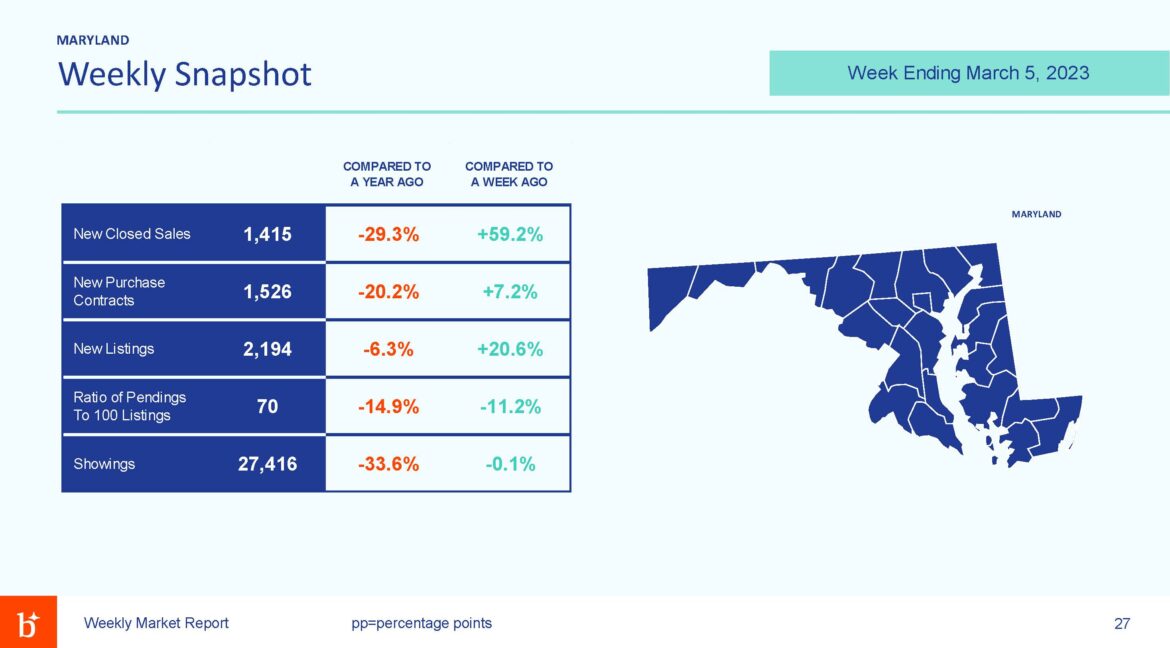
Here are the Bright MLS Maryland Real Estate Market Stats for the week ending March 5, 2023. Check back for more weekly Maryland Market Stats.

Market Statistics
Here are the Bright MLS Maryland Real Estate Market Stats for the week ending March 5, 2023. Check back for more weekly Maryland Market Stats.
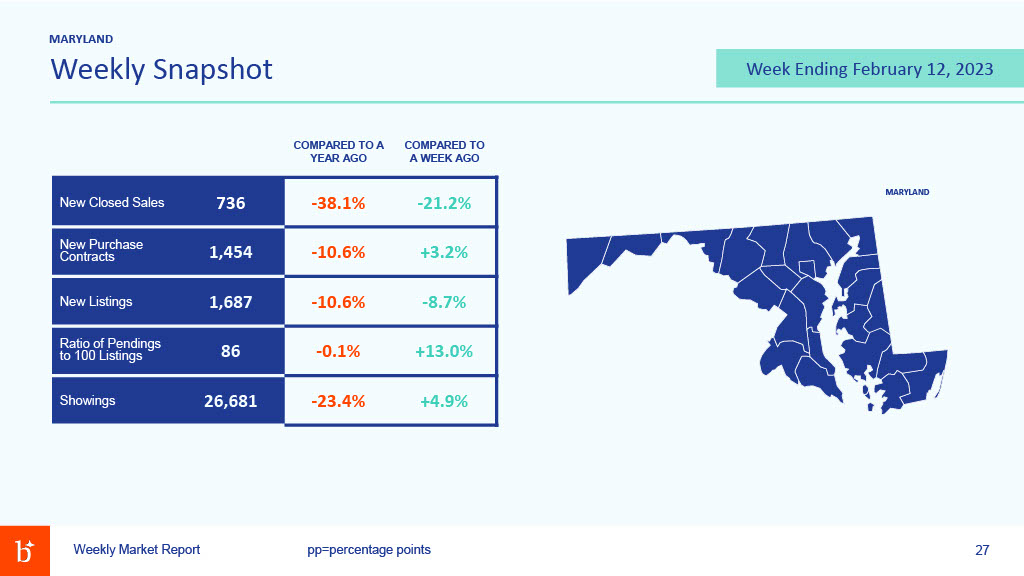
Here are that Bright MLS Weekly Maryland Market Reports for the Week ending Feb 12, 2023.
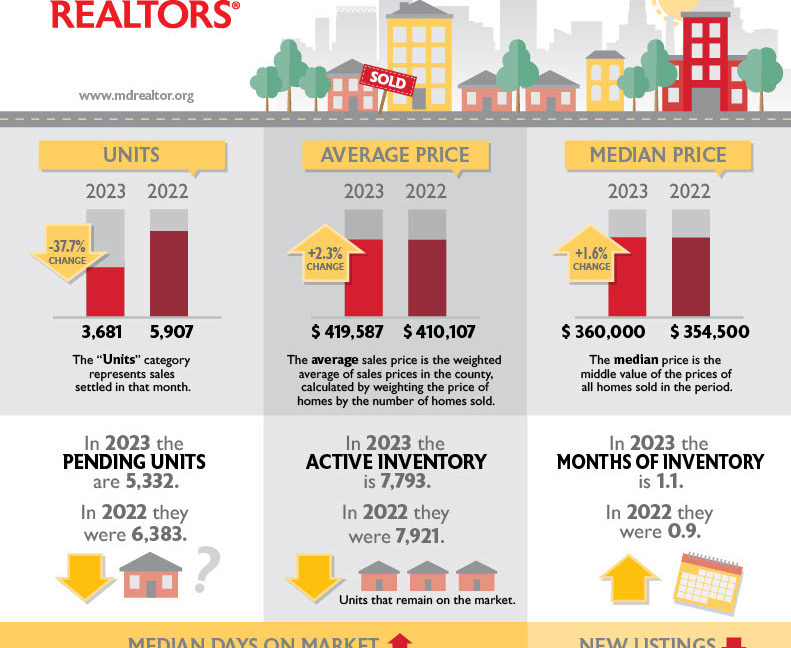
Here are some Jan 2023 Maryland Association of Realtors Housing Statistics and Infographics. Also, check out the Housing Demand Charts from MAR at https://www.homedemandindex.com/washington-dc/february-2023/
https://youtube.com/shorts/WbsmiJcik-A?feature=share
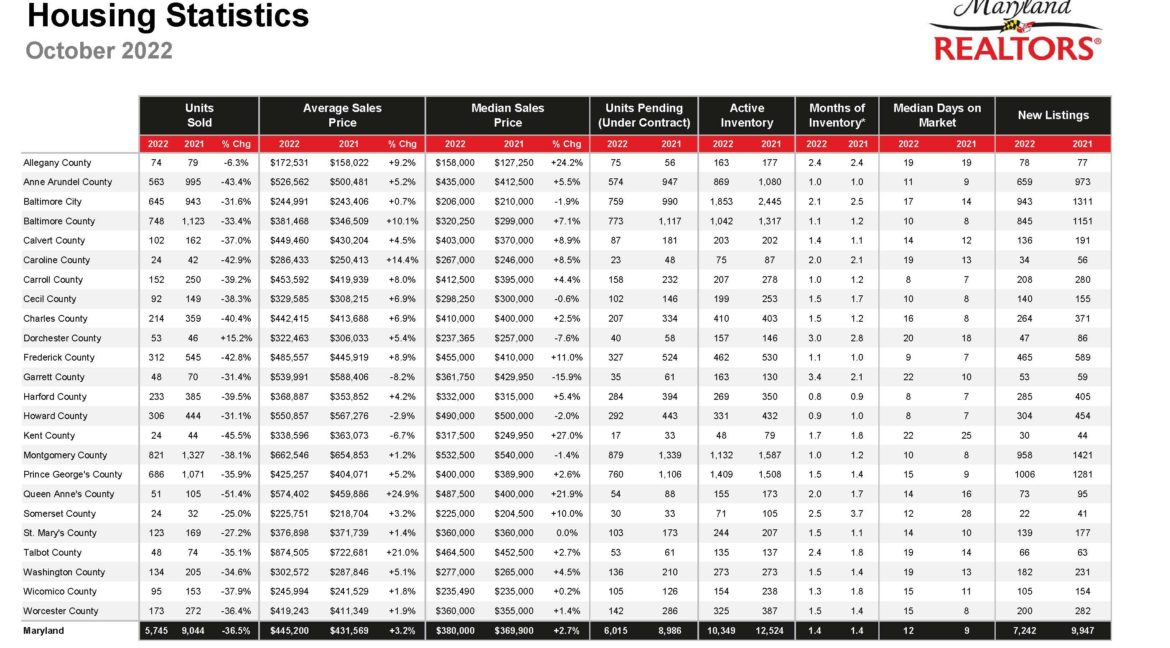
Check back for the October National Housing Report that’s available the end of the Month!
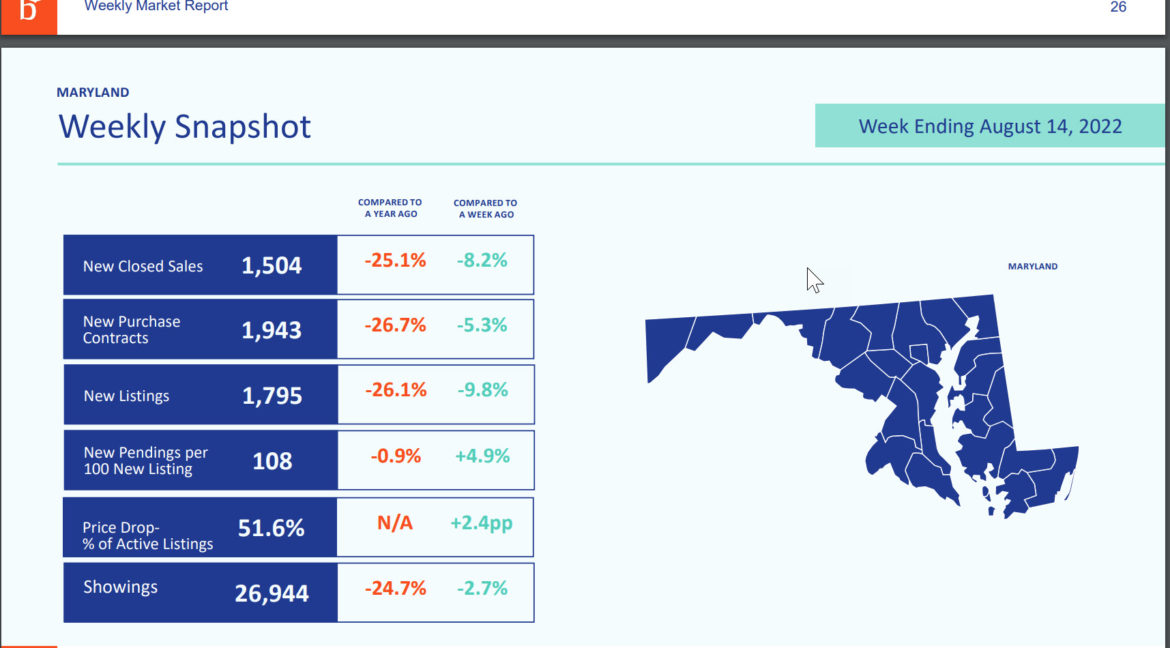
Here are the Bright MLS Weekly Market Reports for the week ending August 14, 2022. The reports below cover a synopsis for the Bright footprint along with Maryland showings, contracts, listings, pendings and closed sales. Check back next week for more “Golden Results” updates!
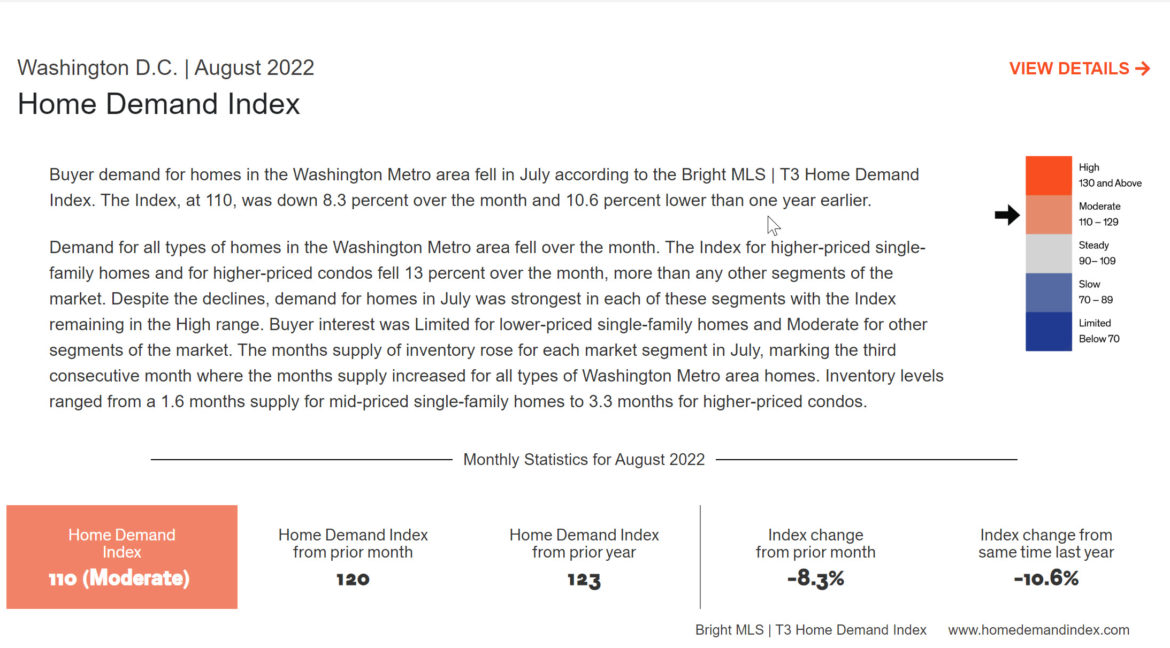
Here’s the Bright MLS August 2022 Home Demand Index. Looks like it’s in the Moderate Range for August 2022 with an 8.3% dip from July 2022. It’s the third consecutive month where month’s supply has increased. Check back next month for more Golden Results Market information with Cheryl Ritchie.
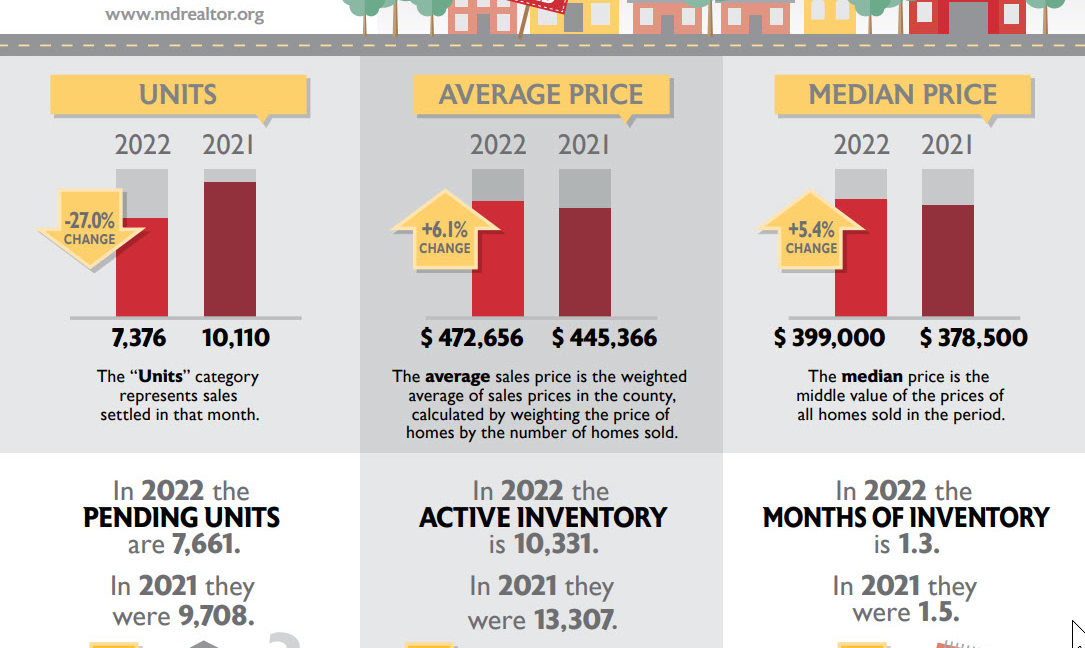
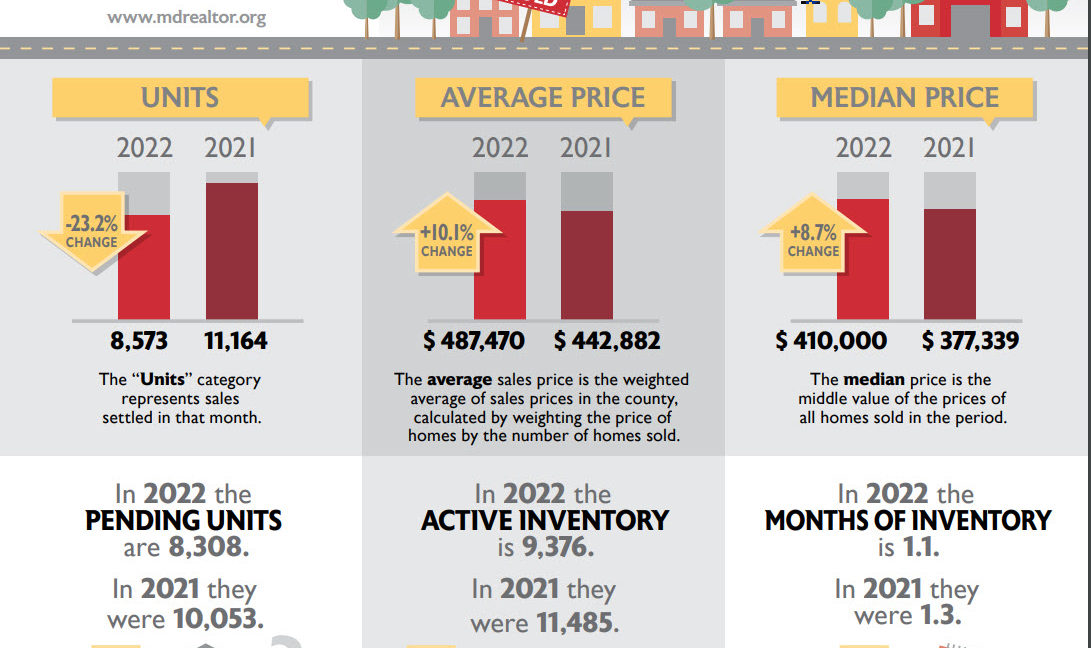
Here are the Mid Month Maryland Association of Realtors August 2022 Market Graphs and Charts for July 2022. The first chart utilizes county by county data. The second chart is a snapshot of Real Estate Maryland data for July 2022. Check back next month for more information.
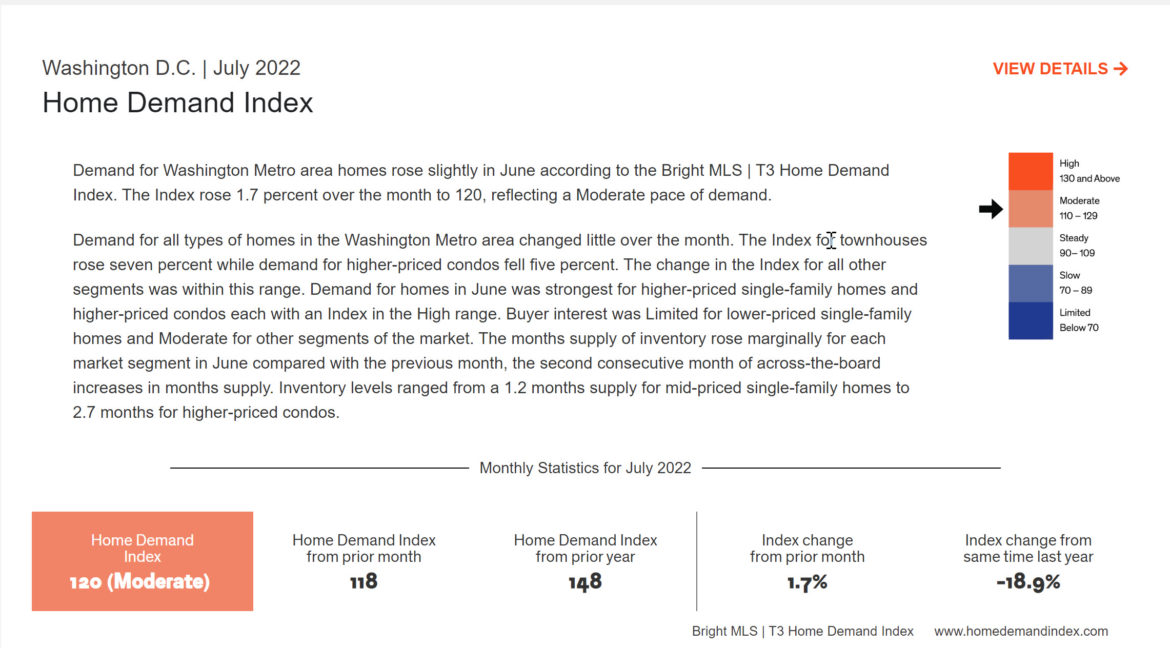
Here’s the latest Bright MLS Home Demand Index which will give insights into the pricing of current homes in the area! It’s a Moderate pace of demand for the July 2022 Washington, D.C. area with an 18.9% index change from last year plus a 1.7 % change from the prior month.

Click here https://vid.us/87hge0 or above to watch the Bomb Bomb National Housing Report for June 2022!
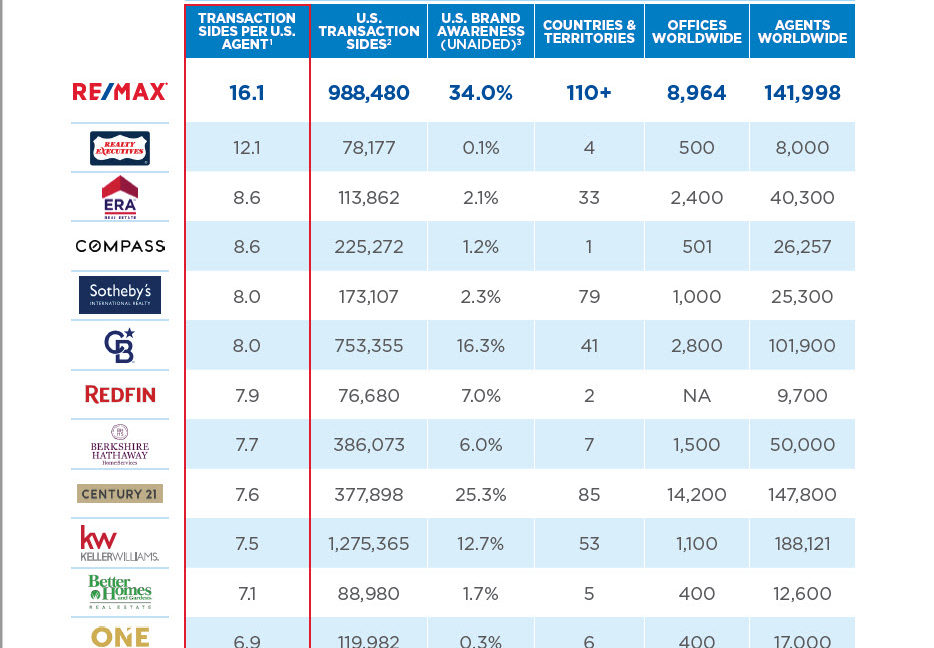
Here’s the 2022 much anticipated RE/MAX vs. the Industry yearly chart that highlights the average 16.1 TRANSACTIONS sides per RE/MAX U.S.Agent! Above the Crowd!
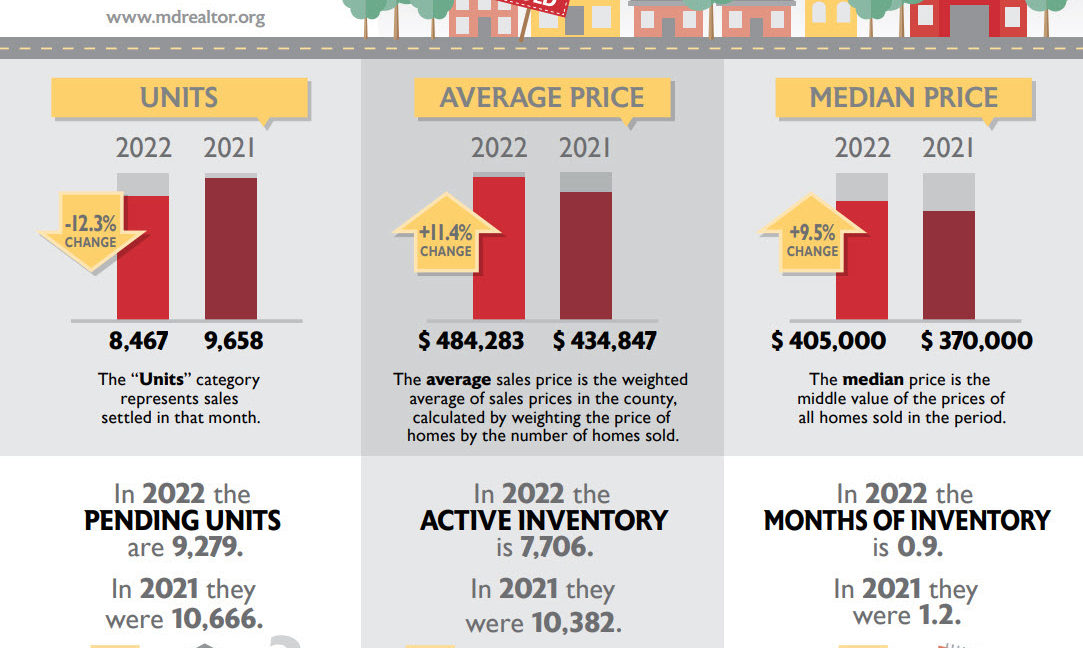
See the the Maryland Mid Month May 2022 Housing Stats below! Check back in a month for the August Charts and Video, too! Or visit the May 2022 Maryland Housing Video at https://www.youtube.com/shorts/7vTguU_Lf_A

It’s Still a Sellers’ Market [INFOGRAPHIC] Some Highlights Due to low supply and high demand, today is one of the strongest sellers’ markets we’ve seen. Sellers can benefit from more offers to pick from, higher home values, and a faster sales process. There’s a reason why 72% of people believe it’s a good time to sell. Don’t miss out on this unique opportunity….
Owning a home is a keystone of wealth… both financial affluence and emotional security.